Finding tidal information
Tidal information gives the times of day when the water is highest and lowest for a given port.
You can buy pocket-sized long-range books of tide tables for individual ports in dive and boat shops. Smartphone apps will give you the same data for multiple ports, often for free.
You can also find tidal information on the internet (see below) and by buying tide prediction software. Newspapers usually publish tidal information for ports all around the country for the current day, which can be useful if you are on a trip.
Smartphone tide apps
There is an increasing number of tide prediction apps for various flavours of smartphone.
- Marine Weather by Bluefin (Android and iPhone) is a free app providing both sea area weather forecasts and the current month’s tide predictions for ports all around Ireland and the U.K.
- UK Tides by Aperto (Android) is a free app providing UKHO 7-day tide data, sunrise and sunset times for ports all around Ireland and the U.K.
- Tide 7 (Android) is an inexpensive app giving UKHO 7-day tide predictions for ports all round Ireland, the U.K., Belgium and the Netherlands.
- Irish Tides (Android) is a no-frills free app giving the current day’s tides for a limited range of Irish ports.
- anyTide for iPhone from the UK National Oceanography Centre gives tides for a limited number of UK and Irish portsas well as computer predictions for all coastline grid locations.
Tidal information websites
UKHO EasyTide
The UK Hydrographic Office (UKHO) website gives tide times for up to 7 days ahead for ports all around the world including about a hundred in Ireland and Northern Ireland.
UK National Tidal and Sea Level Facility
The The National Tidal and Sea Level Facility (part of the UK National Oceanography Centre offers tide predictions for up to four weeks ahead for a small number of ports in Ireland and Northern Ireland. Links for individual ports are below:
The UK NOC has also produced an excellent FAQ pdf on tides.
Irish Sailing Association
The Irish Sailing Association website has tidal information for several ports:
ISA Tide Tables
The Irish Times
The Irish Times also gives tide times for Irish ports for the current day.
Tide prediction software
There are many tide prediction programs. A good one to use is Tide Plotter (from Belfield Software). Depending on licensing option, this can give tidal information for 2011-2013 for 50 Irish ports as well as hundreds more in the UK and northern Europe. The model used may give slightly less accurate figures than the corresponding tide tables calculated for a given port. However, for long-range planning, the program is very useful for giving good tidal prediction for a large number of ports.
Dublin Bay tides
Click here to download a PDF file giving Dublin Bay tides for 2024. The times are the same as those on the Irish Sailing Association page, and should be reasonably accurate. Tides can be checked against other sources, such as UKHO Easytide nearer to the day in question.
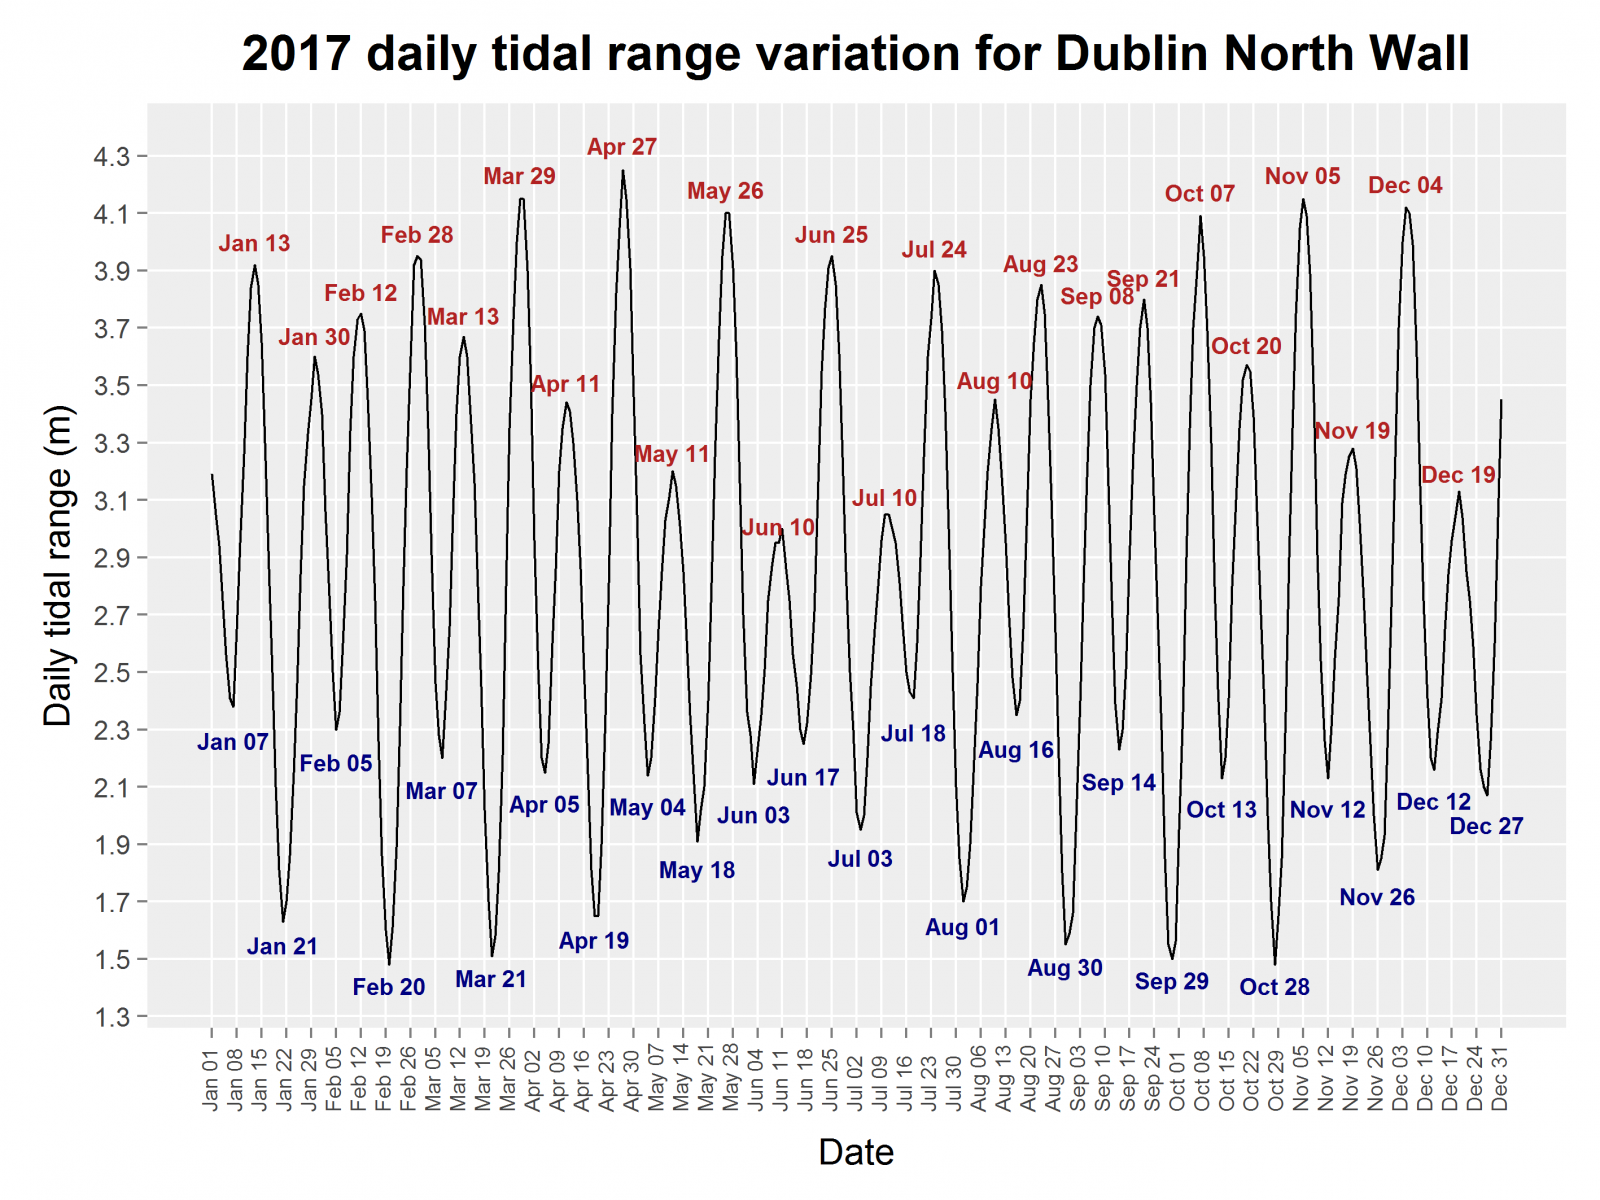
The graph below shows the mean height difference in metres between high and low water at Dublin North Wall for each day in 2017. Peaks on the graph (13 Jan, 30 Jan etc.) show days on which spring tides occur. Troughs (07 Jan, 21 Jan etc.) show neap tide days. Higher peaks represent more extreme spring tides, and lower troughs mark the least tidal neaps.
Dublin Bay tides & slack water
Information on tide times can be found from the sources given above. Once you have found the time of high or low water (correcting for local time if necessary), you can predict what the tide will be doing at a given time. (NB slack water does not necessarily occur directly at high or low water.). The following information is derived from looking at the nautical charts for Dublin Bay. See the next section for a description of how to do this.
The nearest tidal diamond (i.e. tidal information) for Dublin Bay is on the Kish bank (near the Kish lighthouse), so the information is more accurate the closer you are to the Kish bank. Nonetheless, it gives you a fairly good idea of what the tides are doing in the region of Dublin Bay.
Interesting things to note are:
- Tide actually changes direction 1 to 2 hours BEFORE high tide.
- Tide is at its slowest 1 hour BEFORE HW (hence ‘slack’ water is considered to start approx. 1.5 hours before high tide)
- 6 hours after HW is in fact LW, thus the tide changes direction sometime within the hour before LW.
- Slack water seems to start approx. 1 hour before low tide.
As a crude rule of thumb, high water in Dublin Bay on a spring tide is around mid-day (summer time), give or take an hour either way.
An alternative method of forecasting the slack around Dalkey Island and the Muglins is Stewie’s voodoo planner, which can be seen below, or downloaded here if you want to tweek it or make a copy.

Tidal streams for Dublin Bay
| Hours before/ after HW | Speed in knots (Spring tides) | Speed in knots (Neap tides) | Bearing of Tide (Degrees) |
|---|---|---|---|
| -6 | 1.3 | 0.7 | 002 |
| -5 | 2.1 | 1.1 | 002 |
| -4 | 2.1 | 1.2 | 002 |
| -3 | 1.5 | 0.9 | 002 |
| -2 | 0.8 | 0.5 | 002 |
| -1 | 0.1 | 0.0 | 182 |
| High Tide | 1.1 | 0.6 | 182 |
| +1 | 2.0 | 1.1 | 182 |
| +2 | 2.2 | 1.2 | 182 |
| +3 | 1.8 | 1.0 | 182 |
| +4 | 1.0 | 0.5 | 182 |
| +5 | 0.1 | 0.0 | 182 |
| +6 (low tide) | 0.9 | 0.5 | 002 |
How to predict slack water
This section describes how to use nautical charts and tide tables to predict the time of slack water for a given dive site. The information is mostly from DIVE magazine.
First you heed to know what the relevant terms and chart symbols mean. You need to know the difference between a neap tide and a spring tide, and to understand the concept of high water, which is basically the highest point to which the water will get at a specific place. See the glossary for definitions of terms relating to tides.
On a nautical chart, first locate the dive site. Then locate the nearest tidal diamond (a purple diamond-shaped box containing a letter). These mark areas where localised tidal streams have been calculated. The diamond might be quite far from the site, though in this case there is often very little change in the current in this area.
In the tidal stream table on the chart, look up the tidal stream information for the appropriate tidal diamond. This tells you the direction in which the current is travelling and the speed of the current in knots at hourly times relative to the high water mark for a given port.
Once you have found out the state of the current, you need to find the time of high water at the standard port. Tide tables can be found in almanacs, newspapers, on the internet (see links above) or can be purchased separately.
Tide tables also give the height of the tide at the local port, which you can add to the depth shown on the chart to get the real depth.
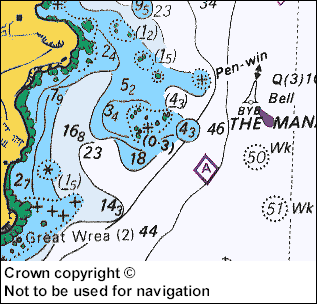
Fig.1: Nautical chart indicating position of dive site
and nearest tidal diamond
The step-by step guide below takes you through the process:
Step one: Find the dive site on the chart. (See chart Fig.1)
Step two: Find the nearest purple tidal diamond to the dive site, which in this case is purple diamond A. (See chart Fig.1)
Step three: Refer to the tidal stream table relating to the diamond (Fig.2). In this case, we look for column A.

Fig.2: Tidal streams table from nautical chart
Step four: Find where the current is least. The left-hand number refers to the speed of the current during spring tide and the right-hand column refers to the speed of the current during neap tide. The current is least at -5 hours from high water (0.0 knots on neaps and 0.1 knots on springs). The second least is +2 hours from high water (only 0.2 knots on a neaps, however 0.4 knots on springs).
Step five: Find the time difference from high water at the designated port, which in this case is Plymouth i.e. -5 and +2 hours.
Step six: Refer to a local tide table or almanac. This will give you the time and height of high and low water and indicate when neap and spring tides occur (See Fig.3).

Fig.3: Tide table for designated port
Step seven: Calculate slack water at the dive site with respect to high water by either adding or subtracting the time difference found in step five (See Fig.3).
Step eight: In this case we are on neaps, which is the time of the month between a new moon and full moon, usually indicated by the small circles. The high water is at 11:23 and 23:38. Subtract the five hours or add the two hours to this time. In this case the two hours is a more suitable time for diving, which is 13:23, rather than 06:23 or 18:38 if you subtract the five hours (See Fig.3).
Step nine: Check what the current is doing either side of the slack water. Here we can see that the speed is 0.2 knots one hour after high water, but it jumps to 0.6 knots at three hours after high water. The best time to get to the site is therefore an hour after high water (See Fig.2).
Step ten: the best time turns out to be between 13:23 and 14:23. As we are now in British summer time and the time displayed in the tide table is Greenwich Mean Time, you have to add an hour.
Launching and retrieving boats – Rule of Twelfths
Tide tables give only the time of low and high water. To estimate the depth of water at any given time you can use the “Rule of Twelfths”. First find the tidal range (subtract high water from low water depth). Then use the table below to work out the height at a given time.
| Time after HW/LW | Tide changes by: | Cumulative: |
|---|---|---|
| 1st hour | 1/12th of the range | 1/12th of the range |
| 2nd hour | 2/12ths | 3/12ths |
| 3rd hour | 3/12ths | 6/12ths |
| 4th hour | 3/12ths | 9/12ths |
| 5th hour | 2/12ths | 11/12ths |
| 6th hour | 1/12ths | 12/12ths |
Tide terms glossary
High water is the highest the tide will get in a 12-hour cycle at a particular location.
Low water is the highest the tide will get in a 12-hour cycle at a particular location.
A knot is a nautical mile per hour.
Neap tides (neaps) occur when the sun and moon are at right angles with each other (1st and 3rd quarters of the moon). The gravitational forces are acting at right angles, so the net effect on the water is reduced. There is less water going in and out of the area, therefore there will be less current.
Spring tides (springs) occur when the sun and moon are in line (new and full moon), causing their gravitational forces to combine leading to increased effect on water movement. As the tide changes, more water is moving in and out, so the current is stronger.
Chart datum is effectively the lowest the tide will ever get. There are occasions when it may be lower, but these tend only to happen very rarely.
Tidal diamonds are purple in colour and pinpoint an area where localised tidal streams have been calculated.
| Attachment | Size |
|---|---|
| Dublin_north_wall_tides_2017.xlsx | 367.84 KB |


